Is the National Debt a Problem?
Are we on a sustainable path, and what are the ways off it?
Start Here: We’ve Been Here Once Before
At the end of World War II, the federal government owed the public more than the whole economy produced in a year. In 1946, debt held by the public reached 106 percent of gross domestic product (GDP). The Congressional Budget Office (CBO) projects that the United States will pass that record around 2030 and keep climbing, to about 175 percent of GDP by 2056.
The last time debt was this high, it fell fast. By 1974 it was under a quarter of GDP. Economists Julien Acalin and Laurence Ball traced how. The war ended, so spending fell. The government ran budget surpluses before counting interest, large ones in 1947 and 1948 and small ones on average through 1974. The economy grew quickly. Surprise inflation, and a period when the Federal Reserve held interest rates down, shrank the real value of the debt. Growth alone, they estimate, would have brought the ratio down only to about 74 percent.
This reading follows three steps. Measure It shows how big the debt is and how to judge its size. Explain It shows what is driving it and why it might or might not matter. Weigh It lays out the ways off this path, who would bear each one, and what other places have tried. The reading on profits and losses argued that losses discipline a business that keeps spending more than it takes in. The question here is how, and how fast, that discipline reaches a government that borrows in its own currency.
WATCH Debt vs. Deficit Explained (Marginal Revolution University)
Measure It: How Big, Compared to What?
1 The deficit fills the tub; the debt is the water
A deficit is a flow: the amount the government spends in a year beyond what it collects. The debt is a stock: the total of past deficits, minus past surpluses, still owed. Think of a bathtub. The deficit is the water running in this year, and the debt is the water already in the tub. In 2024, as the St. Louis Fed’s Page One Economics explains, the government spent $6.8 trillion, took in $4.9 trillion, and borrowed the $1.9 trillion difference.
Two debt numbers show up in the news. Gross debt, the larger one, was about $39 trillion in July 2026, according to Marginal Revolution University. It includes money the government owes to itself, mostly the Social Security and Medicare trust funds. Debt held by the public, about $31 trillion in April 2026 according to the Government Accountability Office (GAO), is what the government owes to outside lenders: people, banks, pension funds, the Federal Reserve, and foreign buyers. Economists usually use the second number, because that is the borrowing that competes for the country’s savings.
Economists also compare the debt to GDP. A $31 trillion debt means something different in a $31 trillion economy than in a $60 trillion one. GDP is a rough measure of the income the country has to carry the debt, the way a lender looks at a borrower’s income, not just the size of the loan.
2 Where we are
CBO’s February 2026 outlook projects the following under current law:
- Debt: about 101 percent of GDP in 2026, 120 percent in 2036, and 175 percent in 2056.
- Deficit: $1.9 trillion in 2026, or 5.8 percent of GDP, rising to 6.7 percent by 2036. The average over the past 50 years was 3.8 percent.
- Interest: net interest is 3.3 percent of GDP in 2026 and 4.6 percent, or $2.1 trillion, in 2036. GAO notes that in fiscal year 2025, interest already cost more than national defense.
- Spending and revenue: spending is 23.3 percent of GDP and revenue 17.5 percent. Revenue is close to its 50-year average of 17.3 percent; spending is well above its own.
The graph puts today’s debt next to the only other time it was this high.
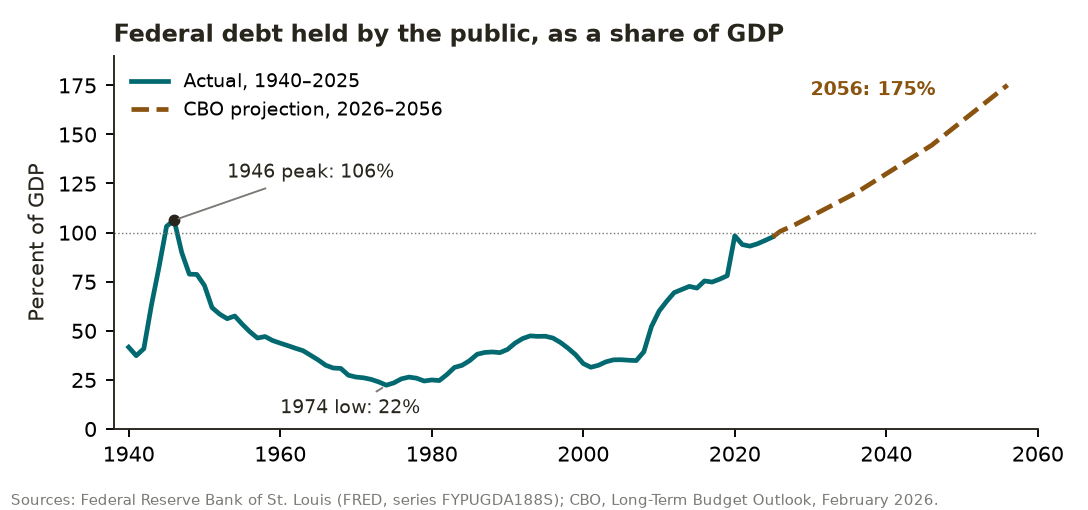
GAO, Congress’s nonpartisan auditor, calls this an “unsustainable fiscal path.” That phrase has a specific meaning: if nothing changes, debt keeps growing faster than the economy, with no point where it levels off.
3 What “sustainable” means
Economists use three yardsticks, and they don’t always agree:
- Is the debt ratio still rising? The simplest test. A debt that grows no faster than the economy can be carried forever, even if it is large.
- How much does the interest cost? Economists Jason Furman and Lawrence Summers argued in 2020 that interest costs are a better guide than the debt ratio. They suggested keeping real interest payments, after inflation, “comfortably below about 2 percent of GDP.”
- Is the interest rate below the growth rate? Economists write this as r versus g. If the interest rate on the debt (r) stays below the economy’s growth rate (g), the economy grows faster than the interest piles up, so the debt ratio can shrink even while the government runs a modest deficit. As St. Louis Fed economist David Andolfatto puts it, when r is below g, “the government is in position to run a primary budget deficit indefinitely.” A primary deficit leaves out interest. If r rises above g, debt grows on its own.
Each yardstick is honest, and each can give a different answer at the same moment. That is one reason economists who agree on the facts still disagree about how worried to be, as the Fair Challenges show.
Explain It: What’s Driving the Debt?
4 Three forces, plus interest
CBO’s long-term outlook finds that by 2056, interest on the debt will cost more than Social Security or Medicare. It points to “the aging U.S. population and growth in per capita spending on health care.” Three forces stand out.
Fewer workers per retiree. Social Security and Medicare are mostly pay-as-you-go: today’s workers pay for today’s retirees. The Social Security Administration counts 2.6 workers per beneficiary in 2025, falling to 2.3 by 2035. Fewer births add to this. The Centers for Disease Control and Prevention reports that the total fertility rate, the number of children the average woman would have over her life, was about 1.6 in 2025, compared with 2.08 in 1990. The Social Security Trustees lowered their long-run assumption in 2026 from 1.90 to 1.75.
Health care costs per person. Medicare spending grows both because there are more enrollees and because each one costs more each year. The Price Check reading on health care explains why.
Revenue that hasn’t kept up. Revenue is near its long-run average, while spending is scheduled to rise. Whether the gap is “too much spending” or “too little revenue” depends on which side you treat as normal, a question the Fair Challenges take up.
On top of all three sits interest. Each year’s deficit adds to the debt, and the bigger debt adds to next year’s interest bill. The graph shows where spending grows between 2026 and 2056.
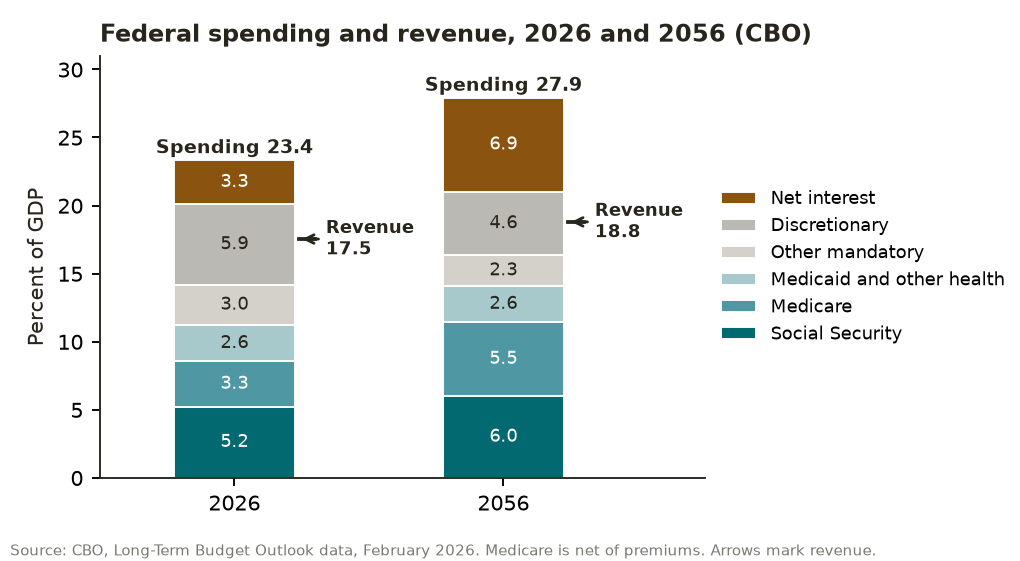
Three slices grow: Social Security, Medicare, and interest. The rest stays flat or shrinks as a share of the economy, including Medicaid and the other programs for lower-income families. Budget analyst Jessica Riedl, in a 2026 report published by the Brookings Institution, estimates that Social Security and Medicare account for 77 percent of federal deficits over the next three decades. Outside those two programs, she finds, deficits would be small enough that debt would slowly shrink as a share of the economy.
Recent laws moved the numbers too. CBO estimates that a 2025 law, Public Law 119-21, which extended and expanded earlier tax cuts and changed some spending programs, adds about $4.7 trillion to deficits over ten years. Higher tariffs were projected to reduce deficits by about $3.0 trillion, though CBO made that estimate before a February 2026 Supreme Court ruling on the tariffs.
5 What it means when a trust fund “runs out”
Social Security and part of Medicare pay benefits from trust funds that hold the program’s past surpluses. The 2026 Trustees Report projects:
- Social Security retirement fund: runs out in late 2032. After that, incoming payroll taxes would cover about 78 percent of scheduled benefits.
- Social Security retirement and disability combined: runs out in 2034, with 83 percent payable.
- Medicare hospital insurance (Part A): runs out in 2033, with 89 percent payable.
“Running out” doesn’t mean the program disappears. Under current law, the program can pay only what comes in, so benefits would be cut automatically, by about a fifth for retirees, unless Congress acts. Medicare’s doctor and drug coverage (Parts B and D) works differently. It can’t run out, because general tax revenue pays about three-quarters of its cost automatically. That is why it adds directly to the deficit. In 2026, general revenue covers about half of Medicare’s income from sources other than interest.
How big a fix would Social Security need? The program’s chief actuary told the Senate in 2026 that closing its 75-year gap would take raising its income by about one-third, cutting scheduled benefits by about one-fourth, or some mix of the two.
6 Why debt can matter, and why it might not yet
A household that borrows too much hits a limit: lenders charge more, then stop lending. The U.S. government borrows in dollars, the world’s main reserve currency, so that discipline arrives more slowly and in different forms:
- Higher interest rates. When the government borrows more, it competes with businesses and home buyers for savings. Economist James Poterba of MIT summarizes CBO research finding that each extra percentage point of debt to GDP raises 10-year Treasury rates by about 0.02 to 0.03 percentage points. That sounds small, but debt is projected to rise by more than 70 points.
- Less room in the budget. Every dollar of interest is a dollar not spent on roads, research, defense, or benefits, or not returned in lower taxes.
- Less room for the next emergency. Borrowing helped pay for World War II, the 2008 financial crisis, and the pandemic. The reading Should Government Fight Recessions? explains why that room matters.
- The risk of a sudden loss of confidence. Former CBO director Douglas Elmendorf and economist Karen Dynan write that fiscal crises are hard to predict, which is an argument for changing course sooner rather than waiting for a warning sign.
There is another side. Investors around the world want U.S. Treasury bonds as a safe place to keep money, which is why the government can borrow at relatively low rates. For much of the period after the 2008 financial crisis, interest rates on federal debt were below the economy’s growth rate, as Andolfatto noted in 2020. But the outlook is sensitive to rates. CBO estimates that if all interest rates were 1.5 percentage points higher than it projects, debt would reach 133 percent of GDP by 2036 instead of 120 percent.
WATCH The Dangers of Fiscal Policy (Marginal Revolution University)
Weigh It: Paths Off the Path
7 The menu
No single change closes a gap this size. Official scorekeepers have priced many options, and here are the main kinds:
- Social Security. Social Security’s actuaries keep a list of about 140 options with their estimated effects. They include raising the retirement age, raising or removing the cap on wages subject to payroll tax ($184,500 in 2026), changing how annual cost-of-living increases are figured, changing the benefit formula, and raising the payroll tax rate.
- Medicare. CBO’s list of options for reducing the deficit includes Medicare changes. A 2026 conference at the Hoover Institution, summarized by Tom Church, collected seven proposals, each designed to save at least $100 billion over ten years. They include paying the same for a service whether it is done in a hospital clinic or a doctor’s office, lowering payments to private Medicare Advantage plans, limiting supplemental plans that cover all out-of-pocket costs, and phasing out the Part B subsidy for high-income enrollees. Church notes that the estimates overlap, so the savings can’t simply be added up.
- Revenue. CBO also scores revenue options, from raising income tax rates to limiting deductions to new taxes. Analysts at the Center on Budget and Policy Priorities argue that “we will have to raise revenue” as part of any solution.
- Growth. Faster growth helps, but less than people hope. Social Security benefits are tied to average wages when a worker retires, so a richer economy also means larger benefits. The reading What Makes Economies Grow? explains where growth comes from.
- Rules. GAO recommends that Congress set a fiscal target, such as a debt ratio to reach by a certain year, add rules to enforce it, and replace the current debt limit with a better tool.
TRY IT The Fiscal Ship (a budget game from the Hutchins Center at the Brookings Institution. Pick your goals for government, then choose from more than 100 tax and spending options to keep the debt from rising.)
8 The cost of waiting
GAO estimated what it would take to bring debt back to 100 percent of GDP by 2056. If changes start in 2026, the government needs a small surplus before interest, 0.2 percent of GDP a year, which means about 26 percent more revenue or 21 percent less program spending each year. If changes wait until 2037, the needed surplus rises to 1.7 percent of GDP: about 42 percent more revenue or 31 percent less spending each year. “The longer actions are delayed,” GAO writes, “the more dramatic they will need to be.”
There is a fairness side, too. Acting early spreads smaller changes over more people and gives workers time to plan. Waiting puts larger changes on fewer people, often with little notice.
9 Times and places that got off the path
The 1983 Social Security amendments. In 1983, Social Security was months from being unable to pay benefits on time. A bipartisan commission led by economist Alan Greenspan proposed a package that Congress passed. It split the burden roughly evenly between taxes and benefits: it brought new federal workers into the system, taxed some benefits for higher-income retirees, delayed a cost-of-living increase, sped up scheduled payroll tax increases, and gradually raised the full retirement age from 65 to 67.
The 1990s budget deals. The Budget Enforcement Act of 1990 set caps on yearly spending bills and a pay-as-you-go rule: new tax cuts or benefit increases had to be paid for. Budget laws in 1993 and 1997 extended those rules. Helped by fast growth and lower defense spending after the Cold War, the government ran surpluses from 1998 to 2001, the first in nearly 30 years. Once surpluses arrived, Congress began working around the rules, and they expired in 2002.
Canada in the mid-1990s. Canada’s 1994–95 Program Review asked every department to justify its spending. The government cut about seven dollars of spending for every dollar of tax increases, eliminated a deficit of 5.3 percent of GDP within three years, and ran surpluses for more than a decade. Its accumulated deficit fell from 67 percent of GDP in 1995–96 to 29 percent in 2007–08.
Sweden’s self-balancing pension. After a deep crisis in the early 1990s, Sweden rebuilt its pension system. Workers contribute a fixed 16 percent of earnings to individual accounts tracked by the government, and benefits adjust to how long people are expected to live. If the system’s promises grow larger than its assets, an automatic brake reduces the yearly increases until it is back in balance. A guaranteed pension protects the lowest earners.
Greece, the warning. Greece shows what happens when markets force the change. Greece uses the euro, so it couldn’t print its own currency. When lenders lost confidence in 2010, it turned to an emergency loan from the International Monetary Fund (IMF) and European governments, with steep spending cuts and tax increases as conditions. The IMF’s own review found the recession was far deeper than projected: output in 2012 was 17 percent below 2009, unemployment reached 25 percent, and the debt still had to be restructured.
Here is the menu in one place, with who bears each option and how soon it works.
| Option | Who bears it | How soon it works | Where the estimate comes from |
|---|---|---|---|
| Raise taxes | Workers, higher earners, or businesses, depending on the tax | Quickly, once passed | CBO revenue options; Social Security actuaries |
| Trim future benefits or raise the retirement age | Future retirees, especially those who can’t work longer | Slowly; usually phased in over years | Social Security actuaries |
| Trim benefits for higher-income retirees | Higher-income retirees | Within a few years | Social Security actuaries; CBO |
| Change how Medicare pays | Hospitals, insurers, doctors, and some enrollees | Within a few years | CBO options; Hoover proposals |
| Cut other spending | Users of those programs; defense | Quickly, but other spending is a shrinking share | CBO options |
| Faster growth | No one directly | Slowly, and uncertain | CBO economic projections |
| Surprise inflation | Bondholders and savers | Helped after 1946; risky and hard to control | Acalin and Ball |
| Fiscal rules | Depends on the later choices the rules force | Only while they are enforced | GAO; the 1990s record |
Fair Challenges
Decide what you think of each challenge first, then open the response.
“A country that borrows in its own currency can’t go broke, so don’t panic.”
“The real problem is tax cuts, not spending.” / “The real problem is spending, not taxes.”
“Just tax the rich.” / “Just cut waste and fraud.”
“Seniors paid for their benefits.”
“Safety-net programs discourage work.”
Economists also disagree among themselves. Three live debates:
- How much does debt raise interest rates and slow growth? The research Poterba summarizes finds a small effect per point of debt that adds up as debt rises. Furman and Summers argue that interest costs, not the debt ratio, are the better warning light.
- Will interest rates stay below growth? Olivier Blanchard, a former IMF chief economist, wrote in 2019 that when r is below g, “public debt may have no fiscal cost,” while adding that his purpose was “not to argue for more public debt.” Rates have risen since then, and CBO projects interest costs growing faster than the economy.
- Should the fix lean on spending or revenue, and how fast? Riedl and Cochrane favor trimming benefits, especially for higher-income retirees. The Center on Budget and Policy Priorities favors raising revenue. GAO’s estimates show that either way, waiting makes the needed change larger.
Notice what evidence can settle and what it can’t. How big the gap is, what drives it, how much each option would save, and how much waiting raises the cost are questions evidence can answer, even when estimates differ. How large government should be, how to share the change among today’s retirees, people near retirement, workers, higher earners, and future generations, and whether Social Security and Medicare should stay universal or focus more on need are questions of values.
What Economics Adds
LISTEN On High and Rising Debt on EconoFact Chats, with Douglas Elmendorf, former director of the Congressional Budget Office, June 28, 2026, with transcript. Elmendorf explains how the debt moved, in his words, “from a fiscal challenge to a fiscal problem,” and what reducing it would take.
LISTEN The Great Fertility Collapse on EconTalk, with Jesús Fernández-Villaverde of the University of Pennsylvania and host Russ Roberts, October 12, 2026, with transcript. They discuss why birth rates are falling worldwide and how an older, slower-growing population makes pensions, health care, and public debt harder to carry.
The Normative Question
If the debt has to stop growing faster than the economy, who should carry more of the change: today’s retirees, people near retirement, workers, higher earners, or future generations? And how soon should it start? Acting early spreads smaller changes over more people but asks for sacrifice before the problem feels urgent. Waiting keeps today’s promises intact but makes tomorrow’s changes larger and more sudden. Economics can show what each choice costs and who bears it. Choosing among them depends on what you think government should promise, how you weigh people now against people later, and who you trust to keep the promises.
Key Terms in Plain Words
- Deficit
- The amount the government spends in a year beyond what it collects.
- Debt held by the public
- What the government owes to outside lenders, the total of past borrowing.
- Gross debt
- Debt held by the public plus what the government owes its own trust funds.
- Debt-to-GDP ratio
- The debt compared with the size of the economy, as a percent.
- Primary deficit
- The deficit not counting interest on the debt.
- Net interest
- What the government pays in interest, minus the interest it earns.
- Trust fund
- An account that holds a program’s past surpluses, such as Social Security’s.
- Depletion
- When a trust fund runs out, so the program can pay only what comes in.
- r versus g
- Whether the interest rate on the debt is below or above the economy’s growth rate.
- Crowding out
- When government borrowing raises interest rates and leaves less saving for private investment.
- Fiscal rule
- A law that limits deficits, debt, or spending, such as a cap or pay-as-you-go rule.
- Effective marginal tax rate
- The share of an extra dollar earned lost to taxes and reduced benefits.
Sources
- Quotations, figures, examples, and videos in this sheet come from the sources below, current as of November 6, 2026.
- Start Here
- Federal Reserve Bank of St. Louis, FRED, “Federal Debt Held by the Public as Percent of Gross Domestic Product” (FYPUGDA188S) fred.stlouisfed.org
- Congressional Budget Office, “Long-Term Budget Outlook Data: 2026 to 2056,” February 25, 2026 cbo.gov
- Committee for a Responsible Federal Budget, “Debt Rises to 175% of GDP Under CBO’s Long-Term Outlook,” February 2026 (year debt passes its record) crfb.org
- Julien Acalin and Laurence Ball, “Did the U.S. Really Grow Out of Its World War II Debt?” IMF Working Paper 2024/005, January 2024 elibrary.imf.org
- American Economic Association, research highlight on Acalin and Ball’s study of the post-WWII debt aeaweb.org
- Marginal Revolution University, “Debt vs. Deficit Explained.” youtube.com
- Measure It
- Mike Kaiman, “Understanding the Federal Budget,” Page One Economics, Federal Reserve Bank of St. Louis, November 2025 stlouisfed.org
- U.S. Government Accountability Office, The Nation’s Fiscal Health: Urgent and Sustained Action Needed to Improve the Fiscal Outlook, GAO-26-108610, June 11, 2026 gao.gov
- Congressional Budget Office, The Budget and Economic Outlook: 2026 to 2036, February 11, 2026 cbo.gov
- Jason Furman and Lawrence H. Summers, “A Reconsideration of Fiscal Policy in the Era of Low Interest Rates,” November 30, 2020 (argument) piie.com
- David Andolfatto, “Does the National Debt Matter?” The Regional Economist, Federal Reserve Bank of St. Louis, Fourth Quarter 2020 stlouisfed.org
- Explain It
- Congressional Budget Office, Long-Term Budget Outlook data workbook, February 2026 cbo.gov
- Social Security Administration, Fast Facts & Figures About Social Security, 2026 ssa.gov
- Social Security Administration, 2026 Trustees Report, “Long-Range Estimates” (workers per beneficiary) ssa.gov
- National Center for Health Statistics, “Births in the United States, 2025,” Data Brief 571 cdc.gov
- National Center for Health Statistics, User Guide to the 2025 Natality Public Use File (total fertility rate) ftp.cdc.gov
- Jessica Riedl, The Progressive Case for Social Security and Medicare Reform, Brookings Institution, October 2026 (argument) brookings.edu
- Social Security and Medicare Boards of Trustees, “A Summary of the 2026 Annual Reports.” ssa.gov
- Social Security Administration, Office of the Chief Actuary, testimony before the Senate Budget Committee, March 25, 2026 ssa.gov
- James Poterba, “Long-Term Fiscal Balance and the Social Security Trust Fund,” Peter G. Peterson Foundation expert views (argument; summarizes Gamber and Seliski, CBO, 2019) pgpf.org
- Karen Dynan and Douglas Elmendorf, “Federal Debt and the Risk of a Fiscal Crisis,” EconoFact, May 26, 2026 econofact.org
- Congressional Budget Office, “Projections of Deficits and Debt Under Two Scenarios With Higher Interest Rates,” October 8, 2026 cbo.gov
- Marginal Revolution University, “The Dangers of Fiscal Policy.” youtube.com
- Weigh It
- Social Security Administration, Office of the Chief Actuary, “Provisions Affecting Social Security Solvency.” ssa.gov
- Congressional Budget Office, “Options for Reducing the Deficit.” cbo.gov
- Tom Church, “Seven Policies to Reduce Medicare Spending and Shrink the Federal Deficit,” October 20, 2026 (argument) church.substack.com
- Hoover Institution, “Hoover Conference Generates Seven Proposals to Reduce Medicare Costs.” hoover.org
- Brendan Duke, Richard Kogan, and Sonali Master, “Federal Policymakers Should Raise Revenue to Address Fiscal and Investment Deficits,” Center on Budget and Policy Priorities, October 23, 2026 (argument) cbpp.org
- Social Security Administration, “National Average Wage Index” (wage indexing of benefits) ssa.gov
- Brookings Institution, Hutchins Center on Fiscal and Monetary Policy, The Fiscal Ship fiscalship.org
- Committee for a Responsible Federal Budget, “GAO Calls for Urgent and Sustained Action on National Debt,” June 2026 (summary of GAO’s cost-of-delay table) crfb.org
- Times And Places
- Congressional Research Service, report R47040 (Social Security financing and the 1983 amendments) congress.gov
- Social Security Administration, “Summary of P.L. 98-21 (H.R. 1900), Social Security Amendments of 1983.” ssa.gov
- Congressional Budget Office, testimony on the Budget Enforcement Act cbo.gov
- Federal Reserve Board, Finance and Economics Discussion Series 2012-38 (on the 1990s budget rules and surpluses) federalreserve.gov
- Congressional Research Service, report RL34712 (on statutory pay-as-you-go rules) congress.gov
- Finance & Development, International Monetary Fund, September 2011 (on Canada’s 1990s fiscal consolidation) imf.org
- Canada School of Public Service, “Spending Reviews.” csps-efpc.gc.ca
- Brookings Institution, “Building Automatic Solvency into U.S. Social Security: Insights from Sweden and Germany.” brookings.edu
- Ole Settergren, Swedish pension system and its automatic balance mechanism, conference paper, Research Institute of Economy, Trade and Industry (Japan) rieti.go.jp
- International Monetary Fund, “Greece: Ex Post Evaluation of Exceptional Access under the 2010 Stand-By Arrangement,” Country Report 13/156, 2013 imf.org
- International Monetary Fund, Independent Evaluation Office, “The IMF’s Role in Greece in the Context of the 2010 Stand-By Arrangement.” elibrary.imf.org
- Singapore
- Central Provident Fund Board, “CPF Overview.” cpf.gov.sg
- Ministry of Manpower, Singapore, “What Is CPF.” mom.gov.sg
- Commonwealth Fund, Singapore country profile, 2026 commonwealthfund.org
- HealthHub, Ministry of Health, Singapore, “Costs and Financing.” healthhub.sg
- Ministry of Finance, Singapore, “What Are the Reserves Used For?” mof.gov.sg
- OECD, Budgeting in Singapore in 2025 oecd.org
- CPF Advisory Panel, Ministry of Manpower, Part 1 Recommendations, Chapter 1 mom.gov.sg
- CNA, “Bridging CPF Gaps: NUS Don Raises Idea of Payouts, Notes Risks.” channelnewsasia.com
- International Monetary Fund, chapter on Singapore’s pension system (adequacy debate) elibrary.imf.org
- Fair Challenges
- Paul Krugman, “The Case Against Bond Market Panic,” August 20, 2026 (argument) paulkrugman.substack.com
- Paul Krugman, “Debt and Tax Cuts,” August 23, 2026 (argument) paulkrugman.substack.com
- Robert Reich, “What No One Will Tell You About the National Debt (but I Will),” 2026 (argument) nny360.com
- C. Eugene Steuerle and Karen E. Smith, “Social Security and Medicare Lifetime Benefits and Taxes: 2025,” Urban Institute, November 2025 urban.org
- John H. Cochrane, “Can We Afford the Welfare State?” November 3, 2026 (argument) thefreedomfrequency.org
- Congressional Budget Office, Effective Marginal Tax Rates for Low- and Moderate-Income Workers in 2016, November 2015 cbo.gov
- National Bureau of Economic Research, “Earned Income Tax Credit Raises Employment,” The Digest, August 2006 (on Eissa and Hoynes) nber.org
- Congressional Research Service, “The Earned Income Tax Credit (EITC): How It Works and Who Receives It,” R44057 congress.gov
- Olivier Blanchard, “Public Debt and Low Interest Rates,” American Economic Review 109, no. 4 (2019): 1197–1229 aeaweb.org
- Podcasts (With Transcripts)
- EconoFact Chats, “On High and Rising Debt” (with Douglas Elmendorf), June 28, 2026 econofact.org
- EconTalk, “The Great Fertility Collapse (with Jesús Fernández-Villaverde),” October 12, 2026 econtalk.org