What Does the Inflation Rate Tell Us?
Why prices rise, how we measure it, and why the rate is a speed, not a distance
Start Here: Inflation Is Down. Why Is Everything Still So Expensive?
In June 2022, consumer prices were 9 percent higher than a year earlier, the fastest rise in four decades. By 2024, the rate had fallen below 3 percent, and news stories said inflation had “come down.” Yet shoppers kept saying that groceries, rent, and car insurance cost far more than they used to. Then, in 2026, the rate climbed again, to 3.7 percent in September, as gasoline prices jumped.
Both claims were true at the same time. Inflation had come down, and prices had not. The difference between those two statements is the most important idea in this reading.
This reading follows the Macro Foundations steps. Define It separates the price level from the inflation rate, and real values from nominal ones. Measure It shows how the Bureau of Labor Statistics (BLS) builds the Consumer Price Index, why there is more than one measure of inflation, what has happened to data quality since 2025, and why your own inflation rate may differ from the average. Explain It looks at what causes inflation, what drove it in 2021–23 and again in 2025–26, why low and steady inflation matters, and how inflation relates to unemployment.
The framework from the Foundations readings applies here too. In Where Do Prices Come From?, a rising price is a signal: it tells buyers to conserve and sellers to bring more. Inflation is different. It is a rise in prices in general, and it adds noise to those signals. When every price is rising, it is harder to tell whether a higher price means “this good is scarcer” or just “money is worth less.” Profits and losses guide businesses only as well as prices carry information, so inflation makes the whole system work less well.
Define It: A Speed, Not a Distance
1 The price level and the inflation rate
The price level is how much a typical set of goods and services costs. The inflation rate is how fast that cost is changing, usually measured as the percentage change from a year earlier. One is a distance; the other is a speed.
Picture a car on a highway. If it slows from 90 miles an hour to 30, it is still moving forward. It hasn’t backed up. In the same way, when inflation falls from 9 percent to 3 percent, prices are still rising, only more slowly. Prices fall on average only when the inflation rate is negative. Economists use three words for this:
- Inflation is a general rise in prices, a positive rate.
- Disinflation is a fall in the inflation rate that leaves it above zero. Prices keep rising, more slowly. This is what happened from 2022 to 2024.
- Deflation is a general fall in prices, a negative rate. The United States last had a full year of it in the 1930s, apart from brief dips such as 2009, and broad deflation has usually come with a deep slump.
The graph shows both ideas since 2019. The left panel is the speed. The right panel is the distance, the price level itself, compared with the path prices would have taken if they had risen a steady 2 percent a year, the Federal Reserve’s target.
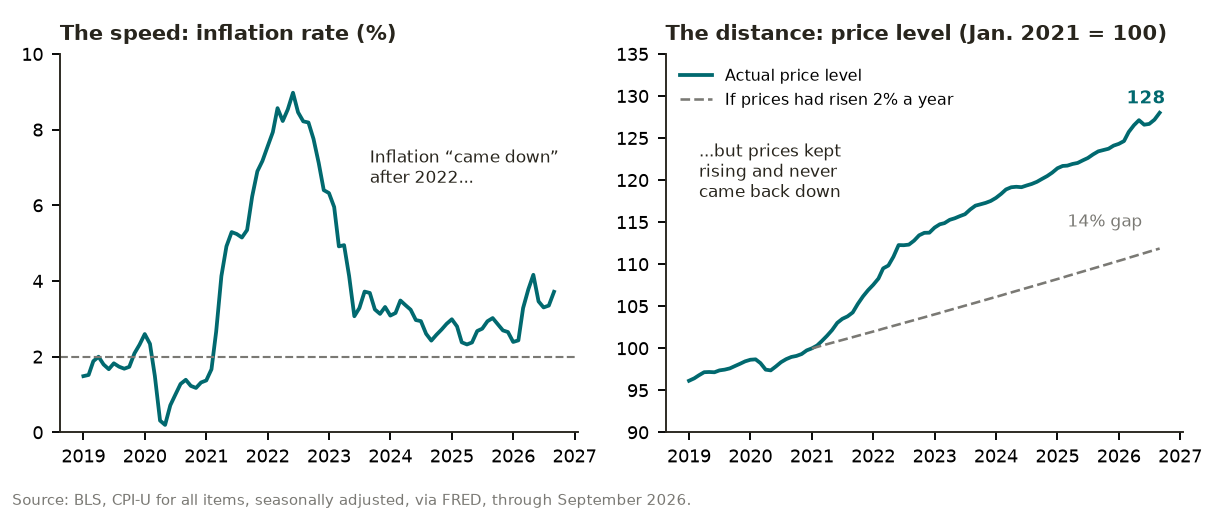
By September 2026, consumer prices were about 28 percent higher than in January 2021. If they had risen 2 percent a year, they would have been about 12 percent higher. The price level is about 14 percent above that steady path, and nothing in the falling inflation rate of 2023 and 2024 brought it back. That gap is what people notice at the store. Prices that have already risen tend to stay up, so the only lasting relief from a jump in the price level is for incomes to catch up.
One more distinction matters. A general rise in prices is not the same as one price rising. When the price of gasoline jumps because of a war in the Middle East, that is a change in relative prices: gasoline becomes more expensive compared with other things. If other prices hold steady, that is a signal at work, not inflation. Inflation is when prices across the economy rise together. In practice both happen at once, and separating them is one of the hard parts of reading the numbers.
READ The Inflation Rate Is Falling, but Prices Are Not (Page One Economics, Federal Reserve Bank of St. Louis, March 2024)
2 Real versus nominal
A nominal value is measured in dollars of the day. A real value is adjusted for inflation, so it measures what those dollars can buy. If your pay rises 4 percent while prices rise 4 percent, your nominal pay is up, but your real pay hasn’t changed. You can buy exactly what you bought before.
Real values are what matter for living standards, and they can tell a different story from the dollar figures. Average hourly earnings rose in the year to September 2026, but prices rose faster. BLS estimates that real average hourly earnings fell 0.7 percent from September 2025 to September 2026. For production and nonsupervisory workers, who make up most of the workforce, they fell 0.6 percent. BLS could not publish the same 12-month comparison for October, for the reason explained in section 4. Month to month, real average hourly earnings were unchanged from September to October.
The same logic applies to interest. If a savings account pays 4 percent and prices rise 3 percent, the real interest rate is about 1 percent. If prices rise 5 percent, the real rate is negative, and the saver loses buying power even while the balance grows. Borrowers face the mirror image: inflation shrinks the real value of what they owe.
People don’t always think in real terms. Economists call the habit of focusing on dollar amounts money illusion. A 5 percent raise during 6 percent inflation can feel like a gain, while a 1 percent raise with no inflation, which leaves a worker better off, can feel like a slight.
WATCH Costs of Inflation: Price Confusion and Money Illusion (Marginal Revolution University)
Measure It: How Do We Know What Prices Are Doing?
3 How BLS builds the Consumer Price Index
The Consumer Price Index (CPI) asks a simple question: how much more does it cost this month to buy the same basket of goods and services that urban households bought in a recent base period? Building it takes three steps.
- A basket. BLS surveys households to learn what people buy and how much they spend on each item, from rent and car insurance to apples and haircuts.
- Prices. Data collectors and online sources record the prices of those items in stores, offices, and websites across the country, and BLS surveys rents from a large sample of housing units. All told, the CPI collects around a million prices a year.
- Weights. Each price change counts in proportion to its share of spending. Shelter, the cost of renting or the rent-equivalent cost of owning a home, is the largest item, at about 35 percent of the index. Gasoline is about 4 percent, so a large jump at the pump can still move the total.
Prices alone are not enough, because the goods themselves change. If a new phone costs 10 percent more but has a far better camera and twice the storage, part of that higher price is paying for a better product, not inflation. BLS uses quality adjustment to try to separate the two. It also has to decide what to do when people switch from beef to chicken because beef got expensive, and when entirely new goods appear.
In 1996, a commission of economists led by Michael Boskin, appointed by the Senate Finance Committee, concluded that the CPI overstated the rise in the cost of living by about 1.1 percentage points a year. The three main reasons were that it missed substitution, did not fully account for better quality, and was slow to add new goods. BLS has since changed its methods, including more quality adjustment and a formula that allows for substitution within categories. BLS notes that some critics now think those changes introduced a downward bias. Either way, the methods are published and open to criticism.
WATCH Understanding Inflation and CPI (Marginal Revolution University)
4 Data quality since 2025
A price index is only as good as the prices that go into it. In 2025, BLS cut back its CPI field collection because of budget limits and a hiring freeze, and suspended collection entirely in three cities: Lincoln, Nebraska; Provo, Utah; and Buffalo, New York. When a price can’t be collected, BLS fills in, or imputes, an estimate from similar items.
The most worrying kind is what BLS calls different-cell imputation. It fills a missing price using prices for the same kind of item from a wider area: for example, using bread prices from across the South Atlantic region when bread prices in Washington, D.C., are missing. In 2019 and again in 2024, different-cell imputation made up roughly 7 to 11 percent of CPI prices. It jumped to 29 percent in April 2025 and 40 percent in September 2025, and it has stayed between 37 and 40 percent ever since. It was 38 percent again in October 2026.
The 2025 government shutdown added a second problem. BLS did not collect October 2025 prices at all and published no October 2025 CPI for most series. A 12-month change compares this month’s index with the same month a year earlier, so when the October 2026 CPI came out on November 10, there was nothing to compare it with. In BLS’s words, it “cannot publish 12-month percent changes for October 2026 for indexes where October 2025 data are unavailable.” The headline “inflation over the past year” number has a hole in it for one month.
BLS did publish what it could. In October 2026, the overall index rose 0.4 percent and core CPI rose 0.3 percent from September, seasonally adjusted. A handful of series had October 2025 data and so kept their 12-month changes: gasoline was up 37.4 percent from a year earlier, new vehicles up 0.7 percent, and used cars and trucks down 3.3 percent. That leaves September’s 12-month rates as the latest available. BLS describes a way to estimate a missing month from the months on either side, but warns that figures calculated this way “cannot be interpreted as official CPI series.” This reading uses only official figures. The hole closes with the November CPI on December 10, because BLS did collect November 2025 prices.
Does this mean the numbers are wrong? Not necessarily. More imputation means more noise, especially for individual cities and items, but BLS notes that response rates alone “do not indicate the presence of bias.” BLS resumed recruiting and hiring in November 2025, began publishing monthly response rates in June 2026, and plans to release measures of the index’s sampling error for 2026 in February 2027. And as the Fair Challenges section shows, independent price trackers have moved closely with the official numbers. The honest answer to “Can we trust the CPI?” is that the national figures remain informative, the fine detail is less reliable than it was, and BLS is publishing the information you need to judge for yourself.
5 Which inflation rate? CPI, PCE, headline, and core
There is more than one measure of inflation, and the differences between them tell a story of their own. The table shows the main measures over the 12 months to September 2026, the latest 12-month figures available. For October, BLS reported only monthly changes for most series: headline CPI rose 0.4 percent and core CPI 0.3 percent.
| Measure | 12 months to Sept. 2026 | What it is |
|---|---|---|
| CPI for all urban consumers (headline CPI) | 3.7% | The most widely reported measure, from BLS. Covers what urban households buy with their own money. |
| Core CPI | 2.6% | CPI excluding food and energy, whose prices swing the most. |
| Chained CPI | 3.5% | A version of CPI that updates weights as people substitute between categories. Used to adjust federal tax brackets. |
| CPI for wage earners (CPI-W) | 3.9% | CPI for households that earn most of their income from hourly and clerical jobs. Used to set Social Security’s cost-of-living increase. |
| PCE price index | 3.6% | From the Bureau of Economic Analysis (BEA). Covers all consumer spending, including what employers and government pay on people’s behalf. |
| Core PCE | 3.1% | PCE excluding food and energy. The Fed watches it most closely. |
| Trimmed mean PCE (Dallas Fed) | 2.3% | Drops the categories with the most extreme price changes each month, high and low, and averages the rest. |
Three distinctions explain most of the table:
- Headline versus core. Food and energy prices jump and fall with weather, wars, and harvests. Core inflation removes them to show the underlying trend, not because food and gasoline don’t matter. Over the year to September 2026, energy prices were up 20.4 percent and gasoline 34.2 percent, so headline CPI ran well above core. Gasoline was up 37.4 percent over the year to October, one of the few 12-month changes BLS could publish for that month.
- CPI versus PCE. The PCE index covers more spending, such as health care paid by employers and Medicare, and it adjusts its weights as people substitute. Shelter is more than a third of the CPI but a much smaller share of PCE. The Fed has set its 2 percent target in terms of PCE since 2012.
- Core versus trimmed mean. Core removes the same two categories every month. The trimmed mean removes whatever is most extreme that month. In 2026 the two have parted ways: core PCE was 3.1 percent, but the trimmed mean was 2.3 percent. That gap suggests that a few categories with very large increases are pulling up the average, while most prices are rising closer to 2 percent.
One more pattern is unusual. For most of the past 30 years, core CPI has run above core PCE. In 2026 the order flipped. Analysts at the Fed and in financial firms point to three reasons. Shelter, which has a much bigger weight in the CPI, has slowed. Fees for investment management, which rise with the stock market and are included only in PCE, have climbed. And software, computers, and other electronics, whose prices rose quickly in 2026 with the surge in demand from data centers and artificial intelligence, carry more weight in PCE. Which index looks “worse” depends on what is driving prices.
The figures have practical consequences. Social Security benefits rise each January by the change in CPI-W from the third quarter of one year to the next. The Social Security Administration announced that benefits will rise 3.6 percent in January 2027. Federal tax brackets are adjusted using chained CPI, which usually rises more slowly, so brackets rise a bit less than benefits.
READ Making Sense of Inflation Measures (Federal Reserve Bank of St. Louis, Regional Economist, September 2022)
6 Your inflation versus the average
The CPI measures the average experience of urban households. Nobody buys the average basket. Your own inflation rate depends on what you buy:
- Renters and owners. Renters feel rent increases directly. Homeowners with fixed-rate mortgages pay the same each month, though their insurance and property taxes may rise. Someone shopping for a first home faces both high prices and higher mortgage rates.
- Commuters. A worker who drives 40 miles each way felt the 37 percent rise in gasoline prices over the year to October 2026 far more than someone who walks or takes the bus.
- Food at home and away. Grocery prices rose 1.8 percent over the year to September 2026, while restaurant meals rose 3.5 percent, partly because restaurant prices include more labor costs.
- Retirees. Older households spend more on health care and less on things like tuition and child care, so their inflation can differ from younger households’.
This is one reason people often feel that official inflation understates their experience. The things people buy often and notice most, such as gasoline and groceries, are not always the things that move the average. The Price Check readings, Why Are Gas Prices So High?, Why Are Groceries So Expensive?, and Why Is Housing So Expensive?, look at those prices one at a time.
7 Expectations
What people expect inflation to be can affect what it becomes. If workers expect prices to rise 5 percent next year, they ask for larger raises. If businesses expect their costs to rise, they raise prices sooner. Expectations that drift up can make inflation harder to bring down, which is why the Fed tracks them closely.
Two regular data series measure what households expect. In the New York Fed’s Survey of Consumer Expectations for October 2026, the median household expected inflation of 3.9 percent over the next year, 3.3 percent over three years, and 3.0 percent over five years, all unchanged from September. The University of Michigan’s survey, in its preliminary November reading, showed year-ahead expectations of 4.3 percent, down from 4.7 percent in October but up from 3.4 percent in February, before the conflict with Iran pushed up oil prices. Long-run expectations were 3.4 percent, above the range of 2.8 to 3.2 percent seen in 2024.
Economists read these numbers with care. Households tend to expect more inflation than actually occurs, and their expectations follow the prices they see most, especially gasoline. What matters most to the Fed is whether long-run expectations stay anchored, meaning people believe inflation will return to around 2 percent even after a shock. In 2026, they have risen but not run away.
Explain It: What Makes Prices Rise?
8 What causes inflation?
Economists group the causes of inflation into a few big ideas. They are not rival theories so much as forces that can work at the same time, though economists argue about which matters most in any episode.
- Too much spending for what the economy can produce. When households, businesses, and government try to buy more than the economy can make at current prices, sellers raise prices. In the aggregate demand and aggregate supply model from What Causes Booms and Busts?, this is demand shifting right when output is near its limit.
- Money. Over long periods, prices rise roughly in step with the amount of money relative to the goods it can buy. This is the quantity theory of money. Milton Friedman famously argued that sustained inflation is always a monetary phenomenon. The cases of hyperinflation, such as Germany in 1923 and Zimbabwe in 2008, all involved governments printing money to pay their bills. Over a year or two, however, the link between money and prices is loose, as the reading Where Does Money Come From? explains.
- Supply shocks. When something cuts the supply of a key input, such as oil during a war or computer chips during a pandemic, costs rise and prices follow, even while output falls. That combination is the stagflation discussed in What Causes Booms and Busts?
- Expectations. As section 7 explained, expected inflation can turn into actual inflation through wages and prices.
- Government debt. A newer view, the fiscal theory of the price level, developed by John Cochrane of the Hoover Institution and others, argues that inflation rises when people doubt the government will raise enough future taxes, or cut enough spending, to pay its debt in dollars of today’s value. In this view, a large deficit that people don’t expect to be repaid acts like printing money. It is a serious view with growing attention, but not yet the standard one.
History shows these forces at work. The graph shows inflation since 1960.
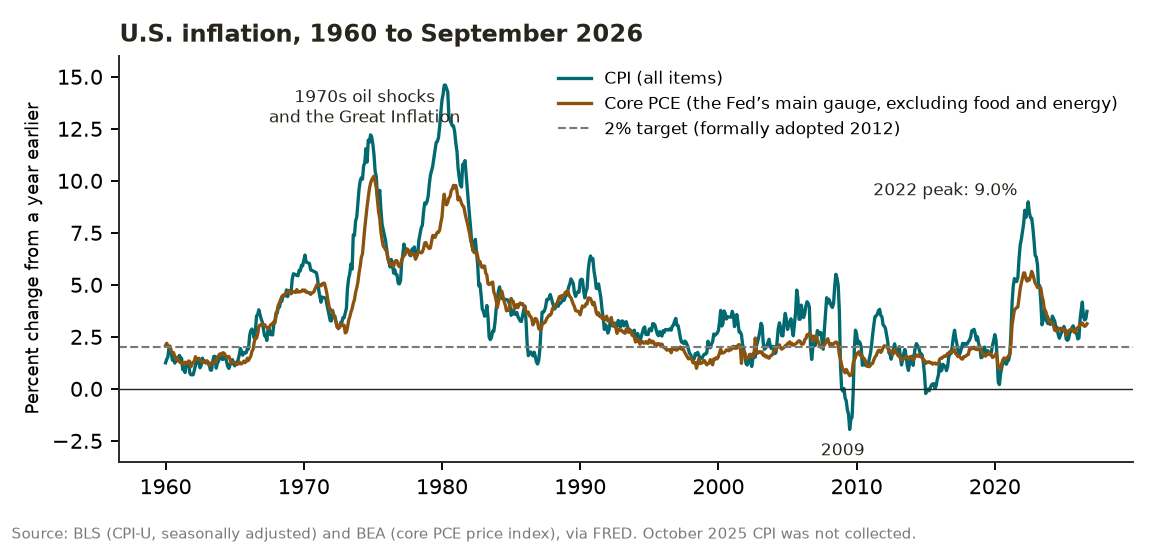
The Great Inflation of the 1970s combined all of these forces: oil shocks, loose monetary policy, deficits, and expectations that rose until people simply assumed high inflation would continue. It took a sharp rise in interest rates under Fed Chair Paul Volcker, and two recessions in the early 1980s, to bring it down. That experience is why central banks now put so much weight on keeping expectations anchored.
WATCH Quantity Theory of Money and How Money Supply Drives Inflation (With Graphs and Examples) (Marginal Revolution University)
9 Case study: the surge of 2021–23
What caused the largest burst of inflation in 40 years is still debated, and the debate is a good example of how economists disagree.
One side emphasizes supply. Ben Bernanke, a former Fed chair, and Olivier Blanchard, a former chief economist of the International Monetary Fund, built a model of prices and wages and concluded that most of the rise in inflation in 2021 and 2022 came from shocks that raised prices directly, such as jumps in energy and food prices and shortages in industries like autos, rather than from wages. Tight labor markets mattered more later, and their effect on inflation lasted longer. Fed staff researchers found that binding supply constraints explain about half of the inflation of 2021 and 2022.
The other side emphasizes demand. In a paper presented at the Brookings Institution in fall 2026, Domenico Giannone and Giorgio Primiceri estimated that about two-thirds of the surge came from demand: pent-up spending as the pandemic eased, large federal relief, which raised the deficit by about 9 percent of GDP, and easy monetary policy. They note that the Fed did not begin raising interest rates until March 2022, when CPI inflation was already 7.9 percent.
The two views overlap more than the headlines suggest. A supply shock raises prices most when demand is strong, and strong demand raises prices most when supply can’t respond. A 2025 review by Fed staff summed up the state of research: “there remains no consensus on the relative importance of each.” What is not in dispute is the outcome: as supply problems eased and the Fed raised interest rates in 2022 and 2023, inflation fell from 9 percent to under 3 percent without a recession.
10 Case study: 2025–26
CPI inflation stayed between about 2.3 and 3.0 percent through 2025 and early 2026. Then it rose, reaching 4.2 percent in May 2026 and 3.7 percent in September. In its July 2026 report to Congress, the Federal Reserve pointed to three forces.
- Energy. The conflict in the Middle East disrupted oil shipments, and gasoline prices rose 34.2 percent over the year to September and 37.4 percent over the year to October. In September alone, gasoline rose 9.1 percent, accounting for more than half of the month’s rise in the overall index. In October, the monthly rise in gasoline slowed to 1.0 percent.
- Tariffs. Higher tariffs raised the prices of many imported goods. A Fed Board study estimated that tariffs had raised core PCE prices by about 0.8 percent through February 2026, and that their pass-through to consumers was “effectively complete.” Economists at the Minneapolis Fed questioned how much of the rise in goods inflation tariffs can explain. They found that the categories most exposed to tariffs did not show the pattern a tariff story predicts, and that the categories that fit account for “at most 0.2” percentage point. Who Pays for Tariffs? explains how the costs are shared.
- Electronics and AI. Prices for software, computers, and electronics rose quickly, which the Fed said likely reflects the surge in demand for semiconductors from data centers and artificial intelligence.
Notice what is missing from the list: an overheated labor market. Wage growth in 2026 was slower than in 2022, and real wages fell. The trimmed mean in section 5 tells the same story. Most prices were rising at a pace not far from the Fed’s target, while energy, some imported goods, and electronics rose much faster. That pattern looks more like a set of large relative price changes than a broad, demand-driven inflation, though economists disagree about whether it will spread.
11 Why low and steady inflation matters
If wages eventually catch up with prices, why does inflation matter? Economists point to several costs.
- Price confusion. Inflation makes price signals harder to read. A business that sees its prices rising may not know whether demand for its product is up or the dollar is worth less, and may expand when it shouldn’t. Friedrich Hayek, in the Foundations readings, described prices as a system for sharing knowledge; inflation adds static to that system.
- Arbitrary winners and losers. Unexpected inflation transfers wealth from lenders to borrowers and from people on fixed incomes, such as some pensions, to those whose incomes rise with prices. Nobody voted for these transfers.
- Harder planning. When inflation is high, it is usually also unpredictable, which makes long-term contracts, mortgages, and savings plans riskier.
- Taxes on paper gains. Many taxes are based on dollar amounts, so inflation can raise taxes on gains that are not real, such as the “profit” on selling an asset whose price only kept up with inflation.
Hyperinflation shows the extreme case. In Germany in 1923 and Zimbabwe in 2008, prices doubled every few days. Money stopped working as a store of value, and people rushed to spend wages before they lost value or turned to foreign currencies and barter.
Why does the Fed aim for 2 percent rather than zero? The Fed says 2 percent is “most consistent” with its goals of maximum employment and stable prices. Economists give three reasons. Measured inflation likely overstates true inflation a little, as section 3 explained, so zero measured inflation might mean falling prices. A little inflation gives the Fed room to cut interest rates below the inflation rate in a slump. And mild inflation lets real wages adjust in industries that need to shrink without anyone’s pay being cut in dollars, which people resist. The cost of a 2 percent target is that prices double about every 35 years.
WATCH Zimbabwe and Hyperinflation: Who Wants to Be a Trillionaire? and Why Governments Create Inflation (Marginal Revolution University)
12 Inflation and unemployment
In the short run, inflation and unemployment have often moved in opposite directions. When demand is strong, businesses hire more workers and raise prices, so unemployment falls while inflation rises. When demand is weak, the reverse happens. Economists call this relationship the Phillips curve, after the economist A. W. Phillips, who first documented it with British data in 1958.
The trade-off is not stable. In the 1970s, Americans got high inflation and high unemployment at the same time, as supply shocks hit and people came to expect inflation to continue. Friedman and Edmund Phelps had predicted this: once people expect inflation, it takes ever more inflation to keep unemployment low. In the long run, most economists think there is no lasting trade-off.
The 2022–23 period reopened the debate. Many economists expected that bringing inflation down from 9 percent would require a recession and a big rise in unemployment. Instead, inflation fell sharply while unemployment stayed low. One explanation, discussed in What Does the Unemployment Rate Tell Us?, is that job openings were unusually high in 2022, so the labor market could cool by filling fewer openings rather than laying off workers. How the Fed uses interest rates to manage this trade-off is the subject of What Does the Fed Do? How government taxes and spending affect demand is covered in How Does the Government Tax, Spend, and Borrow?
Fair Challenges
Decide what you think of each challenge first, then open the response.
“Inflation is down, so prices should come back down.”
“The government fakes the inflation numbers.”
“Corporate greed caused inflation.”
“Government spending and money printing caused all of it.”
Economists also disagree among themselves. Three live debates:
- Demand or supply in 2021–23? Bernanke and Blanchard find mostly shocks to prices; Giannone and Primiceri find mostly demand. Fed staff conclude there is no consensus yet.
- Money or debt? The standard view gives the central bank primary responsibility for inflation through interest rates and money. The fiscal theory, associated with Cochrane, argues that inflation ultimately depends on whether people believe the government will pay its debts with future surpluses.
- How much do tariffs add? A Fed Board study estimates about 0.8 percent added to core PCE prices through early 2026. Minneapolis Fed economists argue the evidence for tariffs as the main driver of goods inflation is weaker, and that accounting estimates may overstate their effect.
Notice what evidence can settle and what it can’t. How much prices have risen, how accurate the CPI is, how much tariffs or markups added, and how inflation responds to interest rates are questions evidence can answer, even if the answers are uncertain. How much unemployment risk is worth accepting to bring inflation down faster, whether to aim for 2 percent or truly stable prices, and how to weigh savers against borrowers are questions of values.
What Economics Adds
LISTEN What Really Drove Post-Pandemic Inflation? on the Brookings Podcast on Economic Activity, November 5, 2026, with transcript. Louise Sheiner interviews Domenico Giannone and Giorgio Primiceri about their finding that demand drove most of the 2021–23 surge.
LISTEN Why Lower Inflation Isn’t Enough for Affordability (The Grumpy Economist Weekly Rant, Hoover Institution, October 20, 2026. John Cochrane explains why the price level, not the inflation rate, is what people feel, and argues for a policy that would make up past misses.)
The Normative Question
The Fed defines price stability as inflation of 2 percent a year. Under that rule, once inflation has pushed prices up, the Fed aims to slow the rise, not to undo it, so the 14 percent overshoot since 2021 is permanent. Some economists, including Cochrane, argue that the Fed should aim at the price level instead, making up past misses so that savers and people on fixed incomes can count on what a dollar will buy years from now. Others answer that pushing prices back down would require years of below-target inflation and a real risk of recession and job losses, falling hardest on workers who did nothing to cause the overshoot. Should “price stability” mean steady 2 percent inflation, letting bygones be bygones, or a stable price level over time, even at the cost of slower growth? Where you come down depends on how you weigh savers against workers, certainty against flexibility, and today’s costs against tomorrow’s trust in money.
Key Terms in Plain Words
- Price level
- What a typical basket of goods and services costs.
- Inflation rate
- How fast the price level is rising, usually over 12 months.
- Disinflation
- A fall in the inflation rate while prices keep rising.
- Deflation
- A general fall in prices; a negative inflation rate.
- Nominal value
- A value measured in dollars of the day.
- Real value
- A value adjusted for inflation, measuring buying power.
- Consumer Price Index (CPI)
- BLS measure of the cost of a fixed basket of consumer purchases.
- PCE price index
- BEA measure covering all consumer spending; the Fed’s target gauge.
- Core inflation
- Inflation excluding food and energy prices.
- Relative price
- The price of one good compared with others.
- Imputation
- Filling in a missing price with an estimate from similar items.
- Inflation expectations
- What households and businesses expect inflation to be.
- Quantity theory of money
- The idea that, over time, prices rise with money relative to output.
- Supply shock
- A sudden change in the cost or availability of key inputs, such as oil.
- Phillips curve
- The short-run tendency of inflation to rise as unemployment falls.
- Hyperinflation
- Extremely rapid inflation, often 50 percent or more a month.
Sources
- Quotations, figures, examples, and videos in this sheet come from the sources below, current as of November 11, 2026.
- Current Inflation Data
- U.S. Bureau of Labor Statistics, Consumer Price Index news release, October 2026 (released November 10, 2026) bls.gov
- U.S. Bureau of Labor Statistics, Consumer Price Index news release, September 2026 (released October 14, 2026) bls.gov
- U.S. Bureau of Labor Statistics, “Approximating Missing Data Points.” bls.gov
- U.S. Bureau of Labor Statistics, Consumer Price Index, latest news release bls.gov
- U.S. Bureau of Labor Statistics, Real Earnings news release, September 2026 (released October 14, 2026) bls.gov
- U.S. Bureau of Labor Statistics, Real Earnings news release, October 2026 (released November 10, 2026) bls.gov
- U.S. Bureau of Economic Analysis, Personal Consumption Expenditures Price Index bea.gov
- U.S. Bureau of Economic Analysis, PCE Price Index Excluding Food and Energy bea.gov
- Federal Reserve Bank of Dallas, Trimmed Mean PCE Inflation Rate dallasfed.org
- Federal Reserve Bank of St. Louis, FRED, Consumer Price Index for All Urban Consumers (CPIAUCSL) fred.stlouisfed.org
- Federal Reserve Bank of St. Louis, FRED, PCE Price Index Excluding Food and Energy (PCEPILFE) fred.stlouisfed.org
- Social Security Administration, Cost-of-Living Adjustment (COLA) information for 2027 ssa.gov
- Federal Reserve Bank of Atlanta, Wage Growth Tracker atlantafed.org
- Price Level, Real Values, And Measures
- Federal Reserve Bank of St. Louis, Page One Economics, “The Inflation Rate Is Falling, but Prices Are Not,” March 2024 stlouisfed.org
- Federal Reserve Bank of St. Louis, Open Vault, “The Differences between Prices and Inflation Explained,” July 16, 2025 stlouisfed.org
- Federal Reserve Bank of St. Louis, Regional Economist, “Making Sense of Inflation Measures,” September 2022 stlouisfed.org
- U.S. Bureau of Labor Statistics, Beyond the Numbers, “Consumer Price Index Data Quality: How Accurate Is the U.S. CPI?” bls.gov
- Advisory Commission to Study the Consumer Price Index (Boskin Commission), Toward a More Accurate Measure of the Cost of Living, 1996 (Social Security Administration archive) ssa.gov
- J.P. Morgan Asset Management, “The PCE-CPI Gap and the Outlook for Further Fed Tightening” (analysis) am.jpmorgan.com
- Western Asset, “Anomalies in the GDP and Inflation Data,” July 30, 2026 (analysis) westernasset.com
- RBC Economics, “Understanding PCE Deflators: A Primer on the Fed’s Preferred Inflation Measure” (analysis) rbc.com
- Data Quality And The 2025 Shutdown
- U.S. Bureau of Labor Statistics, “Update on CPI Data Collection,” 2026 bls.gov
- U.S. Bureau of Labor Statistics, “2025 Federal Government Shutdown Impact on the CPI: Frequently Asked Questions.” bls.gov
- U.S. Bureau of Labor Statistics, CPI imputation by type, data table bls.gov
- U.S. Bureau of Labor Statistics, CPI imputation, definitions bls.gov
- Expectations
- Federal Reserve Bank of New York, Survey of Consumer Expectations newyorkfed.org
- Federal Reserve Bank of New York, “Inflation Expectations Stable; Labor Market Expectations Mixed,” October 2026 Survey of Consumer Expectations, November 9, 2026 newyorkfed.org
- University of Michigan, Surveys of Consumers sca.isr.umich.edu
- Causes And History
- Federal Reserve History, “The Great Inflation.” federalreservehistory.org
- Federal Reserve History, “Volcker’s Announcement of Anti-Inflation Measures” (the Volcker disinflation) federalreservehistory.org
- Federal Reserve Board, “Why Does the Federal Reserve Aim for Inflation of 2 Percent over the Longer Run?” federalreserve.gov
- John H. Cochrane, “Affordability Trilogy, Part 2,” The Grumpy Economist, October 13, 2026 (argument) grumpy-economist.com
- The 2021–23 Surge
- Ben S. Bernanke and Olivier Blanchard, “What Caused the U.S. Pandemic-Era Inflation?” Brookings summary, 2023 brookings.edu
- Domenico Giannone and Giorgio Primiceri, “Demand-Driven Inflation,” Brookings Papers on Economic Activity, Fall 2026 brookings.edu
- Domenico Giannone and Giorgio Primiceri, “Demand-Driven Inflation,” NBER Working Paper 35980 nber.org
- Federal Reserve Board, Finance and Economics Discussion Series 2025-070, “Inflation since the Pandemic: Lessons and Challenges.” federalreserve.gov
- Federal Reserve Board, Finance and Economics Discussion Series 2023-075, on supply constraints and inflation federalreserve.gov
- 2025–26: Energy, Tariffs, And Electronics
- Board of Governors of the Federal Reserve System, Monetary Policy Report, July 2026, Part 1 federalreserve.gov
- Federal Reserve Board, FEDS Notes, “Detecting Tariff Effects on Consumer Prices in Real Time, Part II,” April 8, 2026 federalreserve.gov
- Federal Reserve Bank of Minneapolis, “Tariffs Can’t Explain Rising Goods Inflation,” April 8, 2026 minneapolisfed.org
- Federal Reserve Bank of Minneapolis, “Initially Delayed, the Pass-Through of Tariffs to Consumer Prices Has Arrived,” 2026 minneapolisfed.org
- Federal Reserve Bank of San Francisco, Economic Letter, “The Effects of Tariffs on the Components of Inflation,” March 2026 frbsf.org
- Fair Challenges: Markups And Independent Prices
- Federal Reserve Bank of Kansas City, Economic Review, “How Much Have Record Corporate Profits Contributed to Recent Inflation?” kansascityfed.org
- Federal Reserve Bank of Kansas City, Economic Bulletin, “Corporate Profits Contributed a Lot to Inflation in 2021 but Little in 2022.” kansascityfed.org
- Federal Reserve Bank of San Francisco, Economic Letter, “Are Markups Driving the Ups and Downs of Inflation?” May 2024 frbsf.org
- Alberto Cavallo, Paola Llamas, and Franco Vazquez, working paper on tracking tariffs with online prices (PriceStats), Harvard Business School, 2026 hbs.edu
- Alberto Cavallo and Roberto Rigobon, “The Billion Prices Project: Using Online Prices for Measurement and Research,” Journal of Economic Perspectives, 2016 hbs.edu
- Videos
- Marginal Revolution University, “Understanding Inflation and CPI.” youtube.com
- Marginal Revolution University, “Costs of Inflation: Price Confusion and Money Illusion.” youtube.com
- Marginal Revolution University, “Quantity Theory of Money.” youtube.com
- Marginal Revolution University, “How Money Supply Drives Inflation (With Graphs and Examples).” youtube.com
- Marginal Revolution University, “Zimbabwe and Hyperinflation: Who Wants to Be a Trillionaire?” youtube.com
- Marginal Revolution University, “Why Governments Create Inflation.” youtube.com
- Podcasts And Commentary
- Brookings Podcast on Economic Activity, “What Really Drove Post-Pandemic Inflation?” November 5, 2026 (with transcript) brookings.edu
- John H. Cochrane, “Why Lower Inflation Isn’t Enough for Affordability,” The Grumpy Economist Weekly Rant, October 20, 2026 (argument) thefreedomfrequency.org