What Does It Really Cost to Make Something?
Production, costs, and the size of the firm
Start Here: The Car That Kept Getting Cheaper
In 1908 a new Ford Model T cost $850. Over the next few years Ford’s engineers broke the work into small steps and brought the car to the workers on a moving line. By early 1914 the plant could turn out a finished Model T “every 93 minutes,” compared with “12½ hours per car under the old stationary assembly methods.” The price kept falling: $490 in 1914 and $260 by 1924.
Meanwhile, Ford was paying its workers more, not less. The work on the line was so dull and relentless that by late 1913 turnover at the plant hit 380 percent: to add 100 workers, the company had to hire 963. In January 1914 Ford announced it would pay $5 for an eight-hour day, up from $2.34 for a nine-hour day.
The Foundations readings set up this question. Why Do Profits and Losses Matter? showed that profits lure businesses toward what customers want and losses push them away from waste. What Is a Good Deal Worth? counted the seller’s gain from each sale but set aside costs a business pays no matter how much it sells. This reading opens up the cost side: how output depends on the workers and equipment a business uses, how costs change as output grows, and why some industries have many small firms while others have a few giants. The next reading, Competition and Monopoly, uses these tools to show how firms decide how much to make and what to charge.
The Model: From Workers to Output
Picture a small pizza shop with one oven, one counter, and a lease on the space. The owner’s question is simple: how many cooks to hire? The answer depends on what each cook adds and what each cook costs.
1 What counts as a cost?
Economists count two kinds of cost. Explicit costs are the bills a business pays: rent, wages, flour. Implicit costs are the value of what the owner gives up without writing a check, such as the salary she could earn working for someone else or the interest her savings could earn if they weren’t tied up in the shop. Why Do Profits and Losses Matter? showed that a business can show a profit on its books and still lose money once implicit costs are counted. All of the costs in this reading are economic costs: explicit plus implicit.
2 The short run and the long run
The short run and the long run are not set lengths of time. They depend on what the business can change. In the short run, at least one input is fixed. The pizza shop is stuck with its oven and its lease for now, but it can hire more cooks or cut hours. In the long run, every input can change: the owner can buy a bigger oven, move to a larger space, or open a second shop. For a food truck the long run might be a few weeks. For an electric power company it can be decades.
3 Diminishing marginal returns
A production function describes how much output a business gets from its inputs. The extra output from one more worker is that worker’s marginal product. Table 1 shows the pizza shop’s production function in the short run, with the oven and space fixed.
Table 1. Cooks and pizzas in one kitchen
| Cooks | Pizzas per day | Marginal product (extra pizzas from the last cook) |
|---|---|---|
| 0 | 0 | — |
| 1 | 40 | 40 |
| 2 | 100 | 60 |
| 3 | 140 | 40 |
| 4 | 168 | 28 |
| 5 | 184 | 16 |
| 6 | 192 | 8 |
The second cook adds more than the first, because two cooks can split the work: one makes dough while the other tops and bakes. After that, each extra cook adds less. The later cooks are not worse workers. They are sharing one oven and one counter, so each new cook has less equipment to work with. This is the law of diminishing marginal returns: when one input is fixed, adding more of another input eventually adds less and less output.
The same idea runs through the macro readings. How Did the World Get Rich? describes the Malthusian trap, in which more farmers on a fixed amount of land each added less. What Makes Economies Grow? shows why a country that only piles up machines will slow down. In each case the way out is to change the fixed input, which is the long run, or to find a better way of doing things, which is a new idea.
The Model: From Output to Costs
4 Fixed, variable, and sunk costs
Fixed costs don’t change with output in the short run. The pizza shop pays $300 a day for rent, the oven lease, and insurance, whether it sells zero pizzas or two hundred. Variable costs rise with output. Here each cook costs $120 a day. To keep the example simple, ingredients are left out; adding them would raise every variable cost without changing the pattern.
A sunk cost is one that has already been paid and can’t be recovered. Fixed and sunk are not the same thing. If the owner can sublet the space to another business, the lease is fixed but not sunk, because some of it can be recovered by closing. A custom oven that no one else would buy is sunk once it is paid for. Why Isn’t Good Good Enough? told the story of theater patrons who, having paid full price for season tickets, went to more plays than those who got discounts, even though the money was gone either way. Only costs that can still be avoided should shape the next decision.
5 The cost formulas
6 The pizza shop’s costs
Table 2 applies the formulas to the pizza shop. The point is not the arithmetic but the patterns in the columns.
Table 2. The pizza shop’s daily costs (fixed cost $300 a day; each cook $120 a day)
| Cooks | Pizzas (Q) | FC | VC | TC = FC + VC | MC = ΔTC ÷ ΔQ | AFC = FC ÷ Q | AVC = VC ÷ Q | ATC = TC ÷ Q |
|---|---|---|---|---|---|---|---|---|
| 0 | 0 | $300 | $0 | $300 | — | — | — | — |
| 1 | 40 | $300 | $120 | $420 | $3.00 | $7.50 | $3.00 | $10.50 |
| 2 | 100 | $300 | $240 | $540 | $2.00 | $3.00 | $2.40 | $5.40 |
| 3 | 140 | $300 | $360 | $660 | $3.00 | $2.14 | $2.57 | $4.71 |
| 4 | 168 | $300 | $480 | $780 | $4.29 | $1.79 | $2.86 | $4.64 |
| 5 | 184 | $300 | $600 | $900 | $7.50 | $1.63 | $3.26 | $4.89 |
| 6 | 192 | $300 | $720 | $1,020 | $15.00 | $1.56 | $3.75 | $5.31 |
Per-pizza figures are rounded to the cent, so AFC + AVC can differ from ATC by a penny.
Read down the marginal cost column. When the second cook adds 60 pizzas for $120, each extra pizza costs $2. When the sixth cook adds only 8 pizzas for the same $120, each extra pizza costs $15. Rising marginal cost is diminishing returns seen from the cost side: each cook costs the same, but adds fewer pizzas.
Average fixed cost falls all the way down, because the same $300 is spread over more pizzas. Average variable cost is lowest at 100 pizzas ($2.40). Average total cost is lowest at 168 pizzas ($4.64). The lowest-cost output is not necessarily the best output for the owner; that depends on the price pizzas sell for, which is the subject of Competition and Monopoly.
7 The cost curves
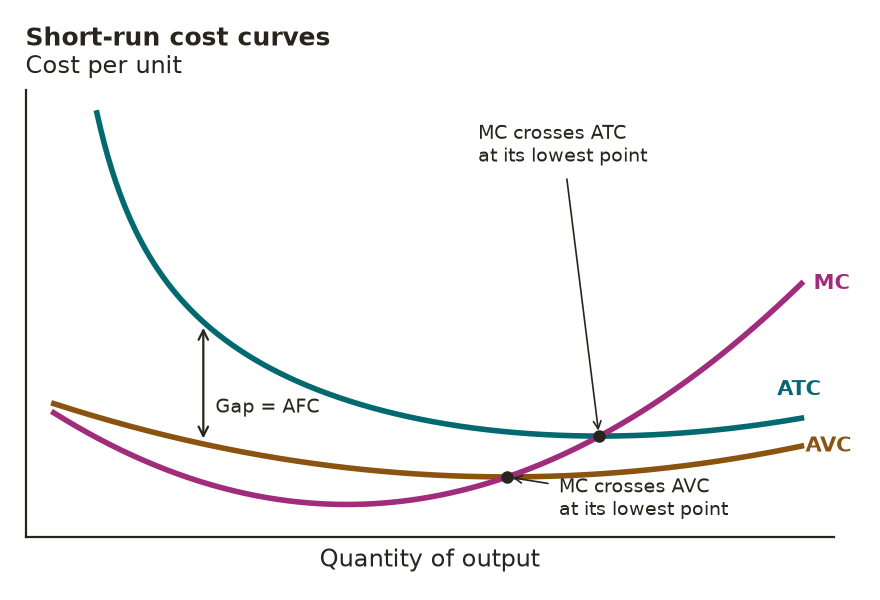
Graph 1 smooths the table into curves, without specific numbers. Marginal cost falls at first, then rises. Average variable cost and average total cost are U-shaped. The vertical gap between them is average fixed cost, and it shrinks as output grows. The marginal cost curve crosses both average curves at their lowest points.
The Model: The Long Run
8 Economies of scale
In the long run the owner can choose how big to be: a larger oven, a conveyor oven, a second location, a central kitchen. Economies of scale exist when average cost falls as the whole operation grows. Larger operations can divide work more finely, spread big fixed costs such as design and equipment over more units, use machines that pay off only at high volume, and buy supplies in bulk.
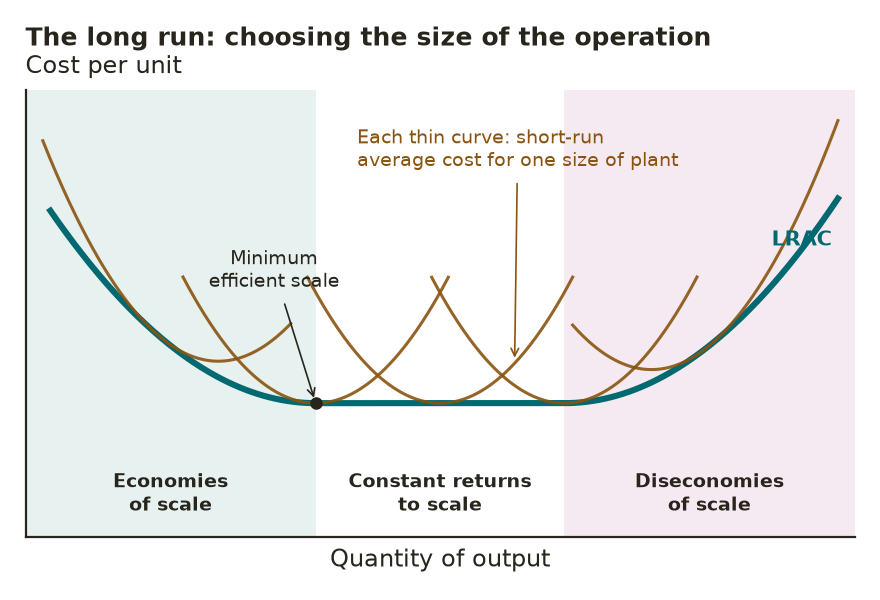
Growth doesn’t lower costs forever. With constant returns to scale, doubling every input roughly doubles output, so cost per unit stays flat. With diseconomies of scale, average cost rises as the operation grows, usually because a very large organization is harder to manage: more layers of supervisors, slower decisions, and less information reaching the people in charge. The smallest output at which average cost reaches its lowest level is called minimum efficient scale.
Minimum efficient scale helps explain why industries look so different. As the OpenStax textbook puts it, “The market demand in conjunction with the long-run average cost curve determines how many firms will exist in a given industry.” If a business reaches its lowest cost while still small compared with the market, as with pizza shops, there is room for many firms. If it must be huge compared with the market, as with makers of large passenger jets, there is room for only a few.
9 The long-run cost curve
Graph 2 shows how the long run is built from many short runs. Each thin curve is the short-run average cost for one size of operation. The long-run average cost curve traces the lowest cost of producing each quantity when the owner can pick any size. It wraps around the short-run curves from below, like an envelope. Drawing that envelope correctly once stumped a famous economist; What Economics Adds tells the story.
10 Learning by doing
11 When the first copy costs a fortune
Some goods cost a great deal to create and very little to copy. A new drug, a piece of software, or a recorded song can take years of work and millions of dollars before the first unit exists. After that, each extra pill, download, or stream costs very little. Fixed cost is huge and marginal cost is tiny, so average total cost keeps falling over a very wide range of output. A price equal to the cost of the last unit would never pay back the cost of the first. That gap is why the cost of making one more is often a poor guide to what a fair or workable price would be, a question Competition and Monopoly takes up.
The Evidence
The model makes predictions that can be checked: average cost should fall with size up to a point and then level off, and experience should lower costs. Some studies test these predictions far better than others.
Electric power: scale economies that run out. Electric utilities are a classic test because power plants have enormous fixed costs. In 1976 Laurits Christensen and William Greene estimated cost curves for U.S. power companies. In 1955 they found “significant scale economies available to nearly all firms.” By 1970, most power came from firms “operating in the essentially flat area of the average cost curve.” Their conclusion: “a small number of extremely large firms are not required for efficient production.” The shape matched the model: falling, then flat. Bigger was cheaper up to a point, and then it wasn’t.
Liberty ships: learning, and its limits. During World War II, American shipyards built cargo ships called Liberty ships to one standard design. The National Park Service reports that average building time fell from 230 days to 39 days by mid-1943. The famous record, a ship launched four days and 15½ hours after its keel was laid, was in the Park Service’s words “a publicity stunt.” Economists long used the Liberty ships as a textbook case of learning by doing. In 2001 Peter Thompson took a closer look. The yards were also adding equipment, and that capital accounts for up to half of the measured gain in productivity. Once capital is counted, the estimated learning effect falls by about half. Speed also had a cost: “over 13 percent of the Liberty fleet developed fractures.” Learning was real, but earlier studies credited it with gains that came partly from more and better equipment.
Solar and nuclear: learning is not automatic. Solar power is the strongest modern case for learning curves. A 2022 study in the journal Joule by Rupert Way and coauthors found that the cost of solar panels has fallen by more than a factor of a thousand since 1958, about 10 percent a year. Not all of that was learning. A 2025 study by Yoga Pratama and coauthors found that for several power technologies, “a substantial portion of the historical cost decline” came from economies of scale “rather than learning processes.” For solar, larger projects spread costs such as land, wiring, and installation over more panels.
Nuclear power in the United States went the other way. A 2020 study from MIT by Philip Eash-Gates and coauthors found that “nth-of-a-kind plants have been more, not less, expensive than first-of-a-kind plants.” More than half of the cost increase from 1976 to 1987 came from “soft” costs such as engineering, supervision, and labor rather than hardware, and changing safety requirements account for about a third of the rise in the cost of the containment building. France, which built many plants to a few standard designs, is a contested case. Arnulf Grübler found that French costs rose over time too, a case he called negative learning by doing. Using later official cost data, Lina Escobar Rangel and François Lévêque found that costs rose less than earlier estimates suggested, and that costs fell as more reactors of the same type were built. The lesson is that learning depends on conditions: stable designs, many repeated units, and rules that don’t keep changing.
Drugs: paying for failures. The Congressional Budget Office reports that estimates of the average research cost per new drug “range from less than $1 billion to more than $2 billion,” in part because “only about 12 percent of drugs entering clinical trials are ultimately approved.” The cost of each success includes the cost of the failures.
The Limits
The cost model is a simplification, and economists from several traditions have questioned parts of it.
Do marginal costs really rise? From 1990 to 1992 the economist Alan Blinder and his team interviewed executives at 200 randomly chosen U.S. firms about how their costs behaved. Only 11 percent reported rising marginal costs. Roughly constant marginal cost was the most common answer, and about 40 percent said marginal cost fell as output grew. Blinder cautioned that “many executives had difficulty understanding the question,” and some may have confused marginal cost with average cost. Even so, he concluded, the discount would have to be severe before the survey showed rising marginal cost to be the norm. Post-Keynesian economists take findings like these as evidence that the U-shaped curves are mostly a classroom device and that real firms set prices by adding a markup to roughly constant costs. Defenders of the standard model reply that rising marginal cost matters mainly when a business runs near capacity, which most firms try to avoid most of the time.
Cost is a choice, not a number. James Buchanan, who won the Nobel Prize in 1986, argued that the true cost of a choice is the value of the best alternative given up, as judged by the person choosing. “This value is and must remain wholly speculative,” he wrote; “only at the moment or instant of choice is cost able to modify behavior.” On this view, cost curves are an outsider’s tidy summary. The real cost lives in the mind of the person deciding, who may weigh things no accountant records.
Why do firms exist, and why do they stop growing? The cost curves treat the firm as a given. Ronald Coase asked in 1937 why firms exist at all, when people could buy each task on the market. His answer was that “there is a cost of using the price mechanism”: finding partners, bargaining, and writing contracts. Firms grow by bringing those tasks inside, and “a firm will tend to expand until the costs of organising an extra transaction within the firm become equal to the costs of carrying out the same transaction by means of an exchange on the open market or the costs of organising in another firm.” That is a deeper account of where diseconomies of scale come from.
Rules can act like an economy of scale. Many regulations require paperwork, compliance staff, and legal review whose cost does not grow much with output. To a business, that works like a fixed cost. A large firm spreads it over many more units than a small one, so a rule can tilt the field toward big firms even when no one intends it to. Large firms sometimes support rules that their smaller rivals can less easily afford. Estimates of how large this effect is vary widely and are disputed. Rules also deliver benefits, and the question is whether they can be designed to protect people without favoring the largest firms.
A learning curve is not a law. Wright’s law describes what happened in many industries, and it has predicted solar costs well. U.S. nuclear power shows that a curve fit to the past is not a promise about the future. Costs can rise with experience when designs keep changing and projects are few.
Fair Challenges
Here are common claims about costs, each with what the evidence shows and where values come in.
- “Bigger companies are always more efficient.” Up to minimum efficient scale, bigger lowers cost per unit. Past that point the evidence from electric power shows costs leveling off, and very large organizations can become harder to run. Whether some firms are too big is also a question about power and fairness, not only cost, and a later reading on competition policy takes it up.
- “Hiring twice as many workers doubles output.” Only if everything else doubles too. With a fixed kitchen, each extra cook adds less. In the long run, doubling every input may more than double output, exactly double it, or less than double it, depending on where the business sits on its long-run cost curve.
- “If a business is losing money, it should close today.” Not necessarily. Some costs must be paid whether the business stays open or closes. The question is whether staying open covers the costs that closing would avoid. Competition and Monopoly works through this decision.
- “If it’s cheap to make, it should be cheap to buy.” The cost of one more unit can be tiny while the cost of creating the first one, including failed attempts, is enormous. A price equal to the cost of the last unit would not pay for the first, and fewer new products would be made. How the upfront cost should be paid for, and by whom, is a question of values as well as evidence.
- “Costs always fall as an industry grows.” Often they do, as with solar panels. Sometimes they don’t, as with U.S. nuclear plants. Learning depends on standard designs, repeated units, and stable rules.
- “Costs are just what’s on the accounting books.” The books leave out implicit costs, such as the owner’s time and the return her savings could earn elsewhere. A shop can show a profit on paper and still be losing money in economic terms.
Notice what evidence can settle and what it can’t. How costs change with output, how much firms learn, and whether a rule raises costs more for small firms than large ones are empirical questions, and the best studies answer many of them well. How big firms should be allowed to grow and who should pay for new products are questions of values.
What Economics Adds
Even economists get tripped up by margins and averages. In 1931 Jacob Viner, one of the leading economists of his day, asked his draftsman, a mathematician named Y. K. Wong, to draw a long-run cost curve that passed through the lowest point of every short-run curve and never rose above any of them. Wong refused, because it can’t be done. On the falling part of the long-run curve, each short-run curve touches it to the left of its own lowest point; on the rising part, to the right, as Graph 2 shows. Viner published the wrong drawing anyway, with a footnote explaining that Wong “saw some mathematical objection to this procedure which I could not succeed in understanding. I could not persuade him to disregard his scruples as a craftsman and to follow my instructions, absurd though they might be.”
When the article was reprinted in 1950, Viner left the error in, “so that future teachers and students may share the pleasure of many of their predecessors of pointing out that if I had known what an ‘envelope’ was I would not have given my excellent draftsman the technically impossible and economically inappropriate assignment.” Economic thinking is careful thinking about the next step, and owning a mistake with good humor is part of it.
READ THE ORIGINAL “Factors Affecting the Cost of Airplanes” (by Theodore P. Wright, Journal of the Aeronautical Sciences (1936), free PDF)
READ Production, Costs, and Industry Structure (OpenStax, Principles of Economics 3e, Chapter 7, Sections 7.2–7.5, free online)
LISTEN Living with Exponential Change (with Azeem Azhar) on EconTalk, March 11, 2024, with transcript. Technology writer Azeem Azhar explains Wright’s law and falling costs for solar panels, batteries, and chips to host Russ Roberts; the learning-curve discussion runs from about minute 6 to minute 20.
The Normative Question
Should government pay to push new technologies down the learning curve? If costs fall as total output grows, the first buyers of a new technology pay high prices but create experience that makes it cheaper for everyone who comes later. Supporters of public support, through subsidies, purchase guarantees, or government buying, argue that this benefit spills over to people who never pay for it, so markets alone will learn too slowly. Critics answer that governments have a weak record at picking which technologies will succeed, that support tends to flow to established interests, that firms already have reason to invest in learning when it pays, and that the nuclear story shows the curve doesn’t always bend down. Evidence can say how much costs fell, how much of the gain spilled over to others, and whether support sped things up. It can’t say how much risk to take with taxpayers’ money or how to weigh cheaper technology later against other uses of that money now.
Germany offers the best-studied test. Its Renewable Energy Sources Act of 2000, made more generous in 2004, guaranteed above-market prices for solar power fed into the grid. From 2004 to 2010, Germany installed about half of the world’s new solar capacity, and by 2012 solar module prices had fallen to 16 percent of their level before the law. The bill was large. One detailed history of solar power puts the cost of supporting more than 30 gigawatts of German solar from 2004 to 2012 at more than €200 billion, added to everyone’s electricity bills. Supporters point to what the money bought. A published study of panel makers found that the subsidy pushed manufacturers around the world to improve their technology, and that close to 90 percent of the extra solar adoption this innovation caused happened outside Germany. That is the spillover argument in its strongest real form: German electricity users paid to move the whole world down the learning curve.
Critics point to who paid and who gained. Returns to installing panels were especially high from 2009 to 2011, and the households that collected them tended to be wealthier, while the cost fell on all electricity users, including poor households. The same study found that improvements by panel makers explained only part of the price decline from 2010 to 2015, so the spillover through innovation, while real, was one piece of a larger story. And German manufacturers did not ride the curve to success. When support was cut and cheaper Chinese panels flooded the market, Q-Cells, once the world’s largest solar cell maker, filed for bankruptcy in 2012. Both sides can be right about the facts. The subsidy helped make solar cheap for the world, and it was an expensive way for Germans to do it, with most of the gains going to people abroad and the costs falling partly on those least able to pay. Whether that was a good bargain depends on how much weight one gives to benefits for people in other countries and to fairness at home.
Key Terms in Plain Words
- Production function
- The relationship between the inputs a business uses and the output it gets.
- Marginal product
- The extra output from adding one more unit of an input, such as one more worker.
- Fixed input
- An input that can’t be changed in the short run, such as a building or an oven.
- Variable input
- An input that can be changed in the short run, such as hours of work.
- Short run
- A period in which at least one input is fixed.
- Long run
- A period long enough that every input can be changed.
- Diminishing returns
- Each added unit of an input adds less output than the one before, when other inputs are fixed.
- Implicit cost
- The value of what an owner gives up without paying a bill, such as her own time or the return her savings could earn elsewhere.
- Fixed cost
- A cost that doesn’t change with output in the short run.
- Variable cost
- A cost that rises and falls with output.
- Sunk cost
- Money, time, or effort already spent that can’t be recovered.
- Total cost
- Fixed cost plus variable cost.
- Marginal cost
- The extra cost of producing one more unit.
- Average fixed cost
- Fixed cost divided by the quantity of output.
- Average variable cost
- Variable cost divided by the quantity of output.
- Average total cost
- Total cost divided by the quantity of output; cost per unit.
- Economies of scale
- Falling average cost as the whole operation grows.
- Constant returns to scale
- Average cost that stays the same as the whole operation grows.
- Diseconomies of scale
- Rising average cost as the whole operation grows, often because large organizations are harder to manage.
- Minimum efficient scale
- The smallest output at which long-run average cost reaches its lowest level.
- Long-run average cost curve
- The lowest cost per unit for each quantity when every input, including the size of the operation, can change.
- Learning curve (Wright’s law)
- The pattern in which cost per unit falls by a steady share each time total output ever produced doubles.
Sources
- Quotations, figures, and examples in this sheet come from the sources below, current as of November 11, 2026.
- The Model T
- Library of Congress, “Ford Implements the Moving Assembly Line,” This Month in Business History guides.loc.gov
- Matt Anderson, “Ford Methods and the Ford Shops,” The Henry Ford thehenryford.org
- The Henry Ford, “Crowd of Applicants outside Highland Park Plant after Five Dollar Day Announcement, January 1914.” thehenryford.org
- The Model
- OpenStax, Principles of Economics 3e, Chapter 7, “Production, Costs, and Industry Structure.” openstax.org
- OpenStax, Principles of Economics 3e, Section 7.1, “Explicit and Implicit Costs, and Accounting and Economic Profit.” openstax.org
- OpenStax, Principles of Economics 3e, Chapter 7, “Key Concepts and Summary.” openstax.org
- Hal R. Arkes and Catherine Blumer, “The Psychology of Sunk Cost,” Organizational Behavior and Human Decision Processes 35, no. 1 (1985): 124–140 doi.org
- Theodore P. Wright, “Factors Affecting the Cost of Airplanes,” Journal of the Aeronautical Sciences 3, no. 4 (1936): 122–128 pdodds.w3.uvm.edu
- The Evidence
- Laurits R. Christensen and William H. Greene, “Economies of Scale in U.S. Electric Power Generation,” Journal of Political Economy 84, no. 4 (1976): 655–676 jstor.org
- National Park Service, “S.S. Scotts Bluff: Forgotten Contributor.” nps.gov
- Peter Thompson, “How Much Did the Liberty Shipbuilders Learn? New Evidence for an Old Case Study,” Journal of Political Economy 109, no. 1 (2001): 103–137 journals.uchicago.edu
- Open-access copy of Thompson (2001) ucema.edu.ar
- Rupert Way, Matthew C. Ives, Penny Mealy, and J. Doyne Farmer, “Empirically Grounded Technology Forecasts and the Energy Transition,” Joule 6, no. 9 (2022): 2057–2082 doi.org
- Yoga W. Pratama, Matthew J. Gidden, Jenna Greene, Andrew Zaiser, Gregory Nemet, and Keywan Riahi, “Learning, Economies of Scale, and Knowledge Gap Effects on Power Generation Technology Cost Improvements,” iScience 28 (2025): 111644 doi.org
- Philip Eash-Gates, Magdalena M. Klemun, Goksin Kavlak, James McNerney, Jacopo Buongiorno, and Jessika E. Trancik, “Sources of Cost Overrun in Nuclear Power Plant Construction Call for a New Approach to Engineering Design,” Joule 4, no. 11 (2020): 2348–2373, MIT open-access copy dspace.mit.edu
- Arnulf Grübler, “The Costs of the French Nuclear Scale-up: A Case of Negative Learning by Doing,” Energy Policy 38, no. 9 (2010): 5174–5188 doi.org
- Lina Escobar Rangel and François Lévêque, “Revisiting the Cost Escalation Curse of Nuclear Power: New Lessons from the French Experience,” Economics of Energy & Environmental Policy 4, no. 2 (2015): 103–126 doi.org
- Congressional Budget Office, “Research and Development in the Pharmaceutical Industry,” April 2021 cbo.gov
- The Limits
- Alan S. Blinder, “On Sticky Prices: Academic Theories Meet the Real World,” in Monetary Policy, ed. N. Gregory Mankiw (University of Chicago Press for NBER, 1994) nber.org
- James M. Buchanan, Cost and Choice: An Inquiry in Economic Theory (1969), Library of Economics and Liberty econlib.org
- R. H. Coase, “The Nature of the Firm,” Economica 4, no. 16 (1937): 386–405 onlinelibrary.wiley.com
- What Economics Adds
- Timothy Taylor, “The Story of Viner’s Draftsman,” Conversable Economist, December 31, 2019 conversableeconomist.com
- John Yinger, Envelopes for Economists, Chapter 3, Syracuse University joyinger.expressions.syr.edu
- The Normative Question
- Francesca de Nicola, Aaditya Mattoo, and Trang Thu Tran, Green Technologies: Decarbonizing Development in East Asia and Pacific, Chapter 2, “Which Green Technologies Are Already Viable?” (World Bank, 2025) openknowledge.worldbank.org
- Gregory F. Nemet, How Solar Energy Became Cheap (Routledge, 2019; 2nd ed. 2025) routledge.com
- Todd D. Gerarden, “Demanding Innovation: The Impact of Consumer Subsidies on Solar Panel Production Costs,” Management Science 69, no. 12 (2023): 7799–7820 doi.org
- Open-access working paper version of Gerarden, Harvard Environmental Economics Program Discussion Paper 18-77 (2018) projects.iq.harvard.edu
- Todd D. Gerarden, Mar Reguant, and Daniel Xu, “The Role of Industrial Policy in the Renewable Energy Sector,” NBER Working Paper 34079 (2025) nber.org
- Mark A. Andor, Manuel Frondel, and Colin Vance, “Installing Photovoltaics in Germany: A License to Print Money?” Economic Analysis and Policy 48 (2015): 106–116 doi.org
- BBC News, “Solar Panel Maker Q-Cells to File for Bankruptcy,” April 2, 2012 bbc.com
- Podcast
- EconTalk, “Living with Exponential Change (with Azeem Azhar),” March 11, 2024 econtalk.org